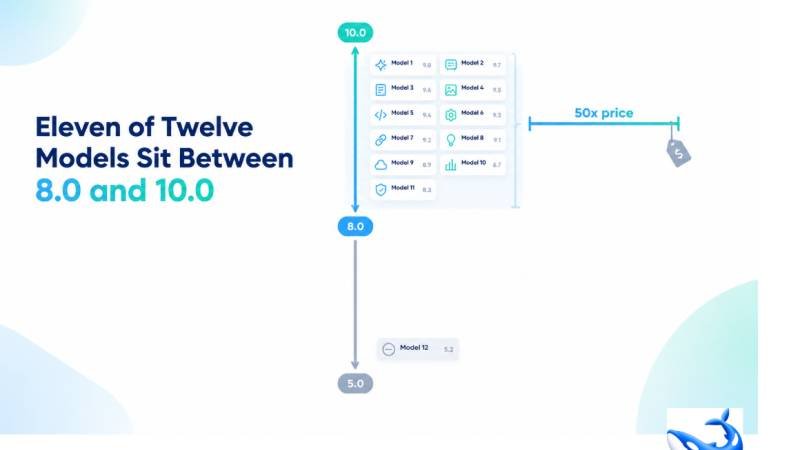
The most striking column on a 2026 model comparison is not the one with the biggest numbers; it is the one with the smallest. On OrcaRouter the llm comparison page grades twelve models on a 0-to-10 quality composite, and eleven of those twelve rows land between 8.0 and 10.0 — a two-point spread holding a fifty-fold price spread. One row scores below the band, and the whole table sits at a quality ceiling.
Read the quality column top to bottom and the story it tells is not about winners. It is about compression: eleven rows, two points, and a price column underneath them that refuses to compress along with it.
The two-point band
The quality score on our comparison page is a composite we build ourselves, grading each model across our own quality dimensions and folding them into one 0-to-10 number — our measurement, not a third-party benchmark. Because it is a composite, it is coarse, and coarseness is exactly what the top of the table looks like. Gemini 3.1 Pro Preview and Claude Fable 5.1 sit at a perfect 10.0. Nine more rows land between 8.0 and 9.0: Claude Opus 5.5, Claude Sonnet 5.5, Gemini 3.8 Flash, Grok 4.7, GPT-5.4 and GPT-6 Sol at 9.0, and DeepSeek V4 Pro, kimi-k2.6 and MiniMax M2.7 highspeed at 8.0. That is eleven rows inside a two-point window, and the row left outside it — Claude Fable 5.1’s sibling on the same table, which scores below the band on the same composite — is the exception that proves the rule.
A two-point band cannot rank eleven rows, and it does not try. What it says is that the top tier of the market has converged: after enough rounds of competition, the flagship-quality tier has become a crowded plateau where being measurably better than the row next to you is harder than it used to be, and where the differences that remain are the ones a single digit was never designed to carry.
The fifty-fold price under the same band
Now read the price column under those same eleven rows, and the compression breaks. The same band that holds eleven rows from 8.0 to 10.0 also holds every price from $0.60 per million input tokens on MiniMax M2.7 highspeed to $30.00 on GPT-5.5 Pro — a fifty-fold spread in the input column, and a steeper one on output, where $1.98 on DeepSeek V4 Pro climbs to $180.00 on GPT-5.5 Pro, roughly ninety-one times as much. Quality compressed; price did not. The two columns, sitting side by side on the same page, have never been further apart.
Run the numbers for yourself and the shape gets concrete. On input, the band’s rows step from $0.60 through $0.66, $0.75, $0.95, $2.00, $2.50, $4.00 and $10.00 before reaching $30.00 — nine distinct prices inside a band where the quality digits are indistinguishable. On output the spread is even wider, from $1.98 through $2.40, $4.00, $6.00, $10.00, $12.00, $15.00, $20.00, $50.00 and up to $180.00. Two rows inside the same quality band — Claude Fable 5.1 at $10 and $50, DeepSeek V4 Pro at $0.66 and $1.98 — sit roughly fifteen times apart on input and twenty-five times apart on output, both wearing the same band on the same table.
That divergence is the most useful fact on the table, because it inverts the lazy reading of any quality column. If a two-point quality band holds rows that are fifty-fold apart in price, then most of what you are paying for at the top of the price column is not quality at all. It is everything a single digit cannot see: brand positioning, speed on a specific task, a coding index that measures something the composite averages away, a context window, a multiplier shape, a latency profile. Claude Fable 5.1 at $10 and $50 and DeepSeek V4 Pro at $0.66 and $1.98 sit inside the same 8.0-to-10.0 band, and the composite is honest enough to admit it cannot tell them apart.
Where the quality ceiling comes from
The compression at the top of the table is not an accident of our scale; it is a feature of how the market has matured. When models compete hard on the same benchmark-heavy tasks, scores converge, because the tasks get solved and the remaining differences move to tasks that are harder to measure. A composite built from our own quality dimensions reflects that: the dimensions that used to separate rows now separate almost none of them, and the digits pile up at the top.
The practical consequence is that the quality column has changed jobs. A few generations ago it could pick your model for you. Today it can only pick your tier, and the tiers are almost one. That is why the rest of the table exists — the price columns, the multiplier, the context window, the latency, the seven-day traffic — and why a comparison page that leads with a single score is leading with the least informative column it has. On a table where eleven of twelve rows share two points, the score is the least informative column it has, and the price is the most. And the ceiling is not a flaw in our scale; a coarser scale would hide the last of the signal, and a finer one would invent differences the market has not earned. Two points for eleven rows is the honest resolution of a field that genuinely converged.
Buying inside a compressed band
The quality ceiling changes how you should buy, and it does it for the better. If eleven rows sit between 8.0 and 10.0, then for most workloads the cheapest row in the band is the honest default, and the premium rows have to earn their gap from columns other than quality. A high-volume, cost-sensitive workload should start at the bottom of the price column — DeepSeek V4 Pro at $0.66 per million input, inside the band at 8.0, carrying 512.0 million tokens of seven-day traffic on our side, more than any other row — and climb only when a concrete column demands it. The opposite reading, paying ten times as much because a row is in the band, is buying a digit that eleven other rows already have.
The caveat that keeps the ceiling honest is the one row below the band. Its existence proves the composite still has teeth: it can push a row down when the dimensions we grade actually warrant it, which means the rows above it are not all there by default. The band is crowded because the top tier genuinely converged, not because we stopped grading. When every model scores the same, doubt the score; when one model scores differently, believe the difference, and check which columns made it happen.
The takeaway
Eleven of the twelve models on our comparison page sit between 8.0 and 10.0 on the quality composite — the score we build ourselves by grading each model across our own quality dimensions, never a third-party benchmark. The same band holds every price from $0.60 to $30.00 per million input tokens and from $1.98 to $180.00 per million output. Quality has compressed; price has not.
The quality ceiling is the real story because it reframes the whole table: when the top tier is a two-point plateau, the score stops picking your model and the price, the context, the latency and the traffic have to. Buy inside the band the way you would buy anything else — start cheap, move up only for a column you can name, and treat a fifty-fold price gap inside a two-point quality band as the single most informative sentence on the page.
Sourcing note: all quality scores, prices, multipliers, context windows, p50 time-to-first-token figures and seven-day token volumes are OrcaRouter production data from the comparison page and the linked model page, read 2026-10-12. Composite quality scores are our own, built by grading each model across our own quality dimensions; they are not a third-party benchmark. Latency and volume figures are rolling telemetry that will drift. All checked 2026-10-12. See more.